The Traces section gives you two complementary views of your agent traffic: a paginated log of every agent run your application has executed, and a flame graph that shows the internal structure of any individual run. Together they let you move from a high-level question like “why did my agent costs spike this afternoon?” down to the exact tool call or LLM interaction that caused it.Documentation Index
Fetch the complete documentation index at: https://docs.lumiqtrace.com/llms.txt
Use this file to discover all available pages before exploring further.
Requests log
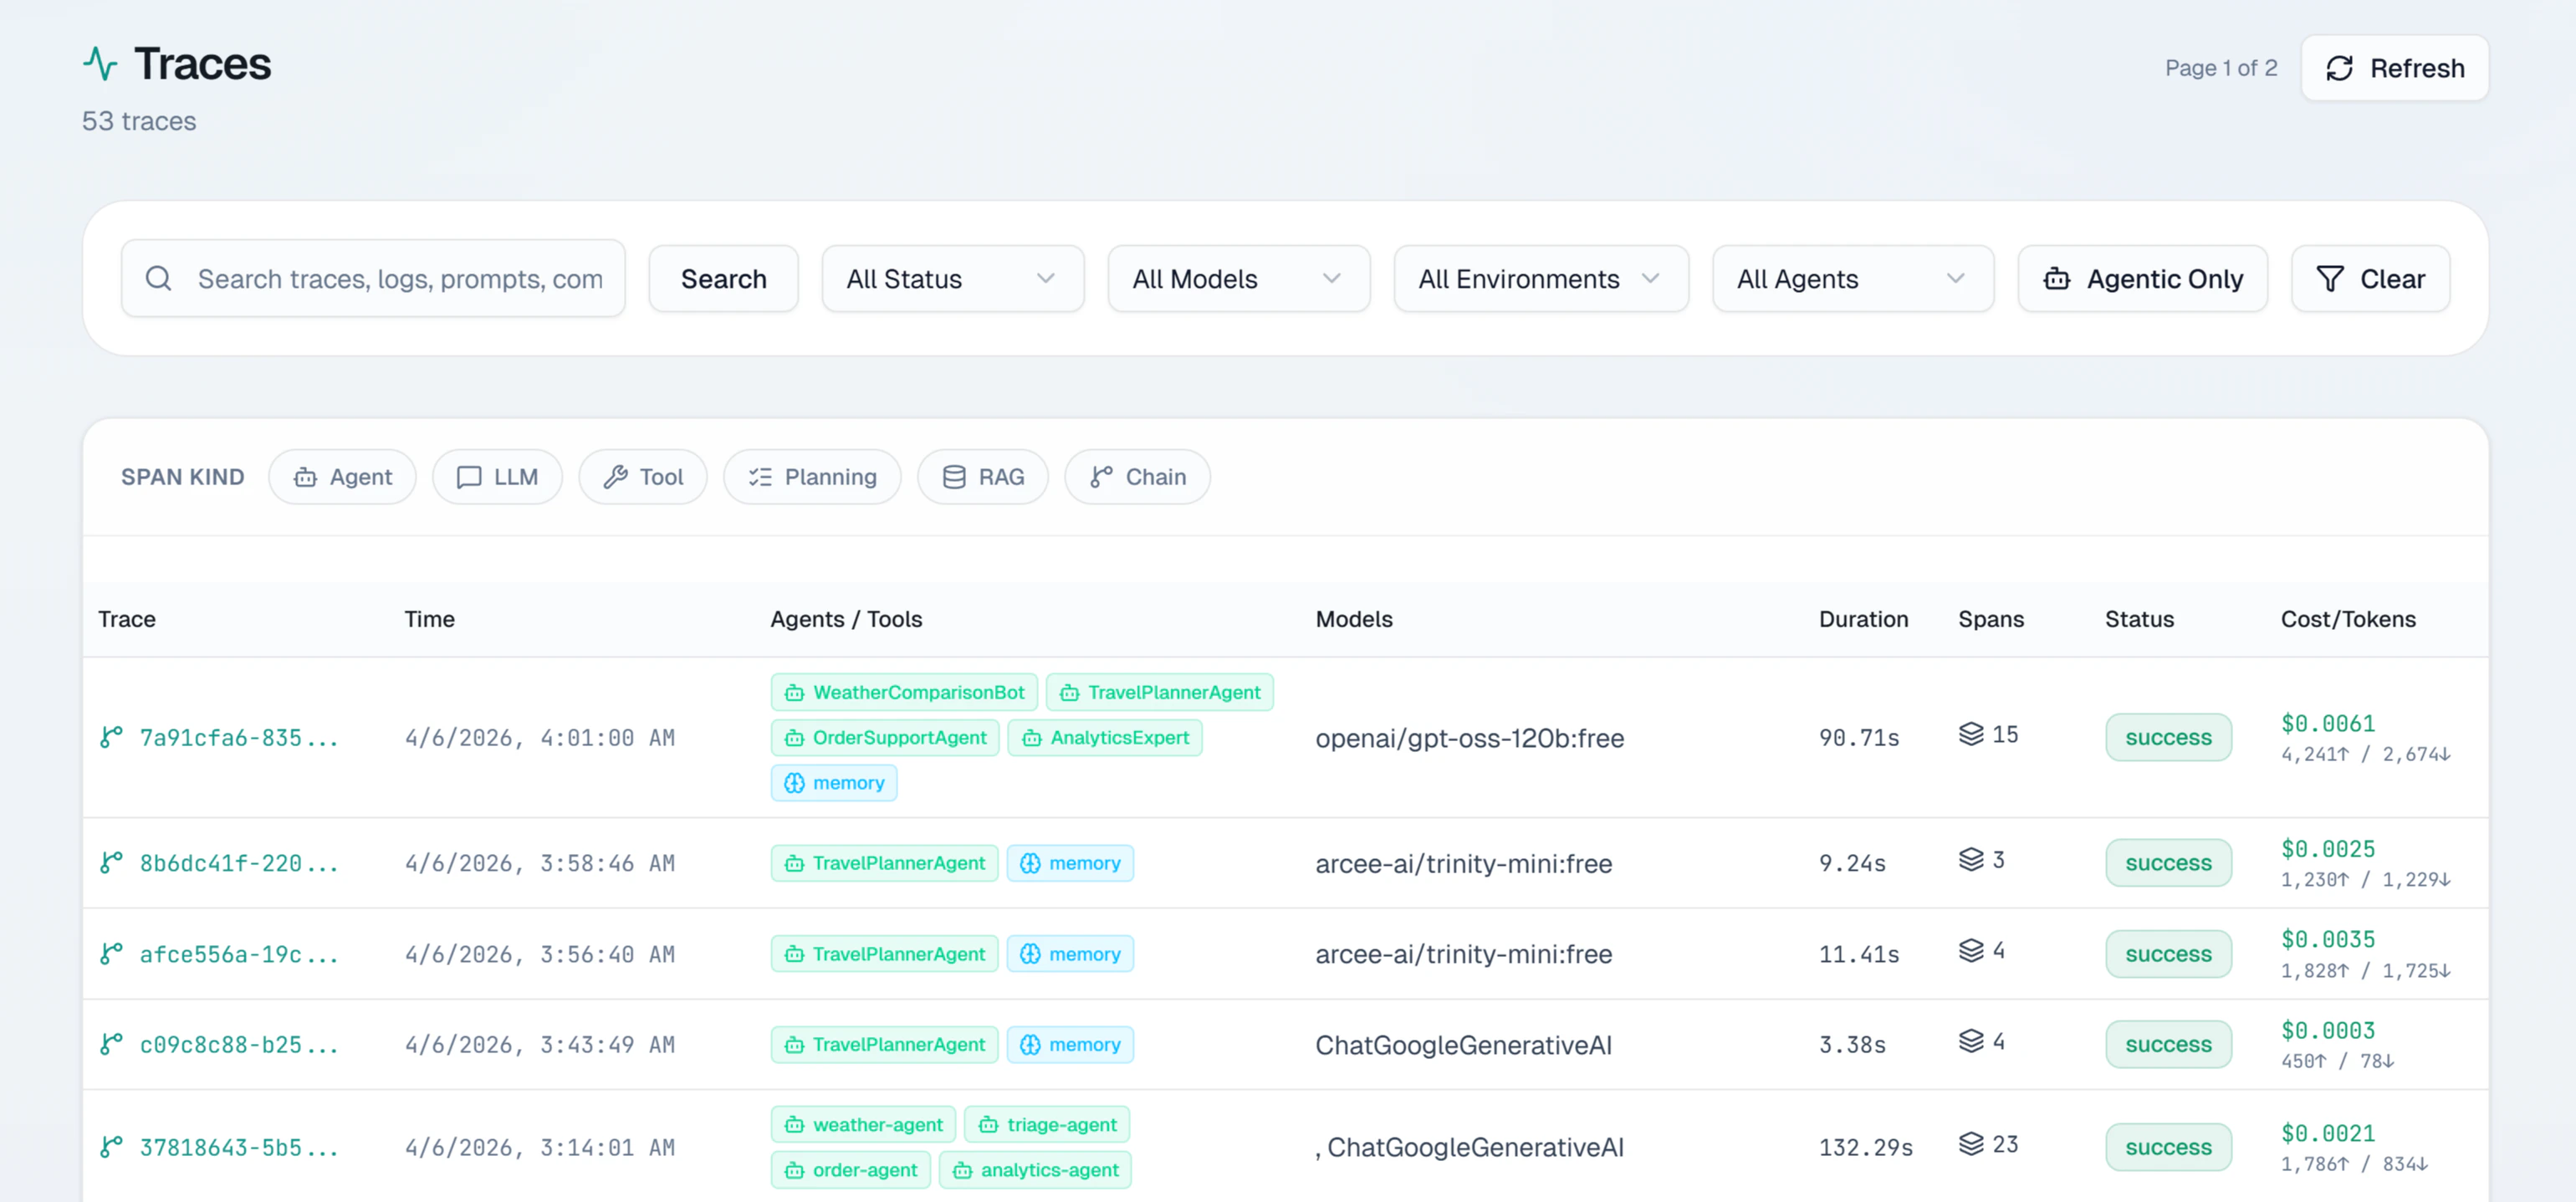
The requests log shows all spans recorded for your project. Each row represents a single operation and shows:| Column | What it shows |
|---|---|
| Timestamp | When the operation ran, in your local timezone |
| Model | The model identifier (e.g. gpt-4o, claude-sonnet-4-6) |
| Status | Outcome: success, error, timeout, or rate_limited |
| Latency | Total duration in milliseconds |
| Cost | USD cost from token counts and model pricing |
| Tokens | Input and output token counts |
Filtering
The filter bar lets you narrow the list by model, status, date range, environment, and user ID. Filters combine freely and the table updates immediately.Pagination
The table uses cursor-based pagination returning up to 200 events per page. Cursor pagination ensures consistent results even if new agent events arrive while you are browsing.Opening a trace
Click any row to open the trace detail view. If the operation is part of a multi-span agent run, you see all spans in the flame graph — agent turns, tool calls, retrieval steps, and every LLM interaction.Trace flame graph
The flame graph shows every span in an agent run on a shared timeline. This is the best way to understand where time was spent and which specific step contributed to cost or errors.Reading the flame graph
- X-axis — wall-clock time from the start of the trace to the end
- Each bar — one span. Width is proportional to duration
- Rows — depth in the call tree. Child spans (tool calls, nested LLM calls) appear below their parent agent span
- Color — outcome of each span
Green — success
The span completed successfully.
Red — error
The span ended in an error.
Yellow — timeout
The span timed out before receiving a response.
Gray — cancelled
The span was cancelled before completing.
Span detail panel
Click any bar to open the span detail panel on the right:- Model — exact model used
- Span kind —
llm,agent,tool,planning,handoff,retriever, orguardrail - Tokens — input, output, and cached token counts
- Cost — USD cost for this span alone
- Latency — duration in milliseconds
- Tool calls — tool names and arguments (for LLM spans that invoked tools)
- Tags — custom tags attached by your SDK
- Finish reason —
stop,length,tool_calls,content_filter, orerror
Explain with AI
Click Explain with AI in the span detail panel to run a root cause analysis on the full agent trace. LumiqTrace examines all spans — timing, errors, token counts, tool call results, and agent delegation chains — and returns:- A plain-English summary of the entire agent run
- The identified root cause type (e.g.
tool_failure,token_limit_exceeded,agent_loop) - The specific problem span
- Contributing factors across the trace
- Step-by-step fix recommendations with implementation notes
- A prevention tip