The overview page is the first thing you see after logging in. It gives you an immediate read on the health of your agent operations: how many runs your agents have processed, what they cost, how fast they responded, and whether anything went wrong. All data refreshes from a 5-minute cache.Documentation Index
Fetch the complete documentation index at: https://docs.lumiqtrace.com/llms.txt
Use this file to discover all available pages before exploring further.
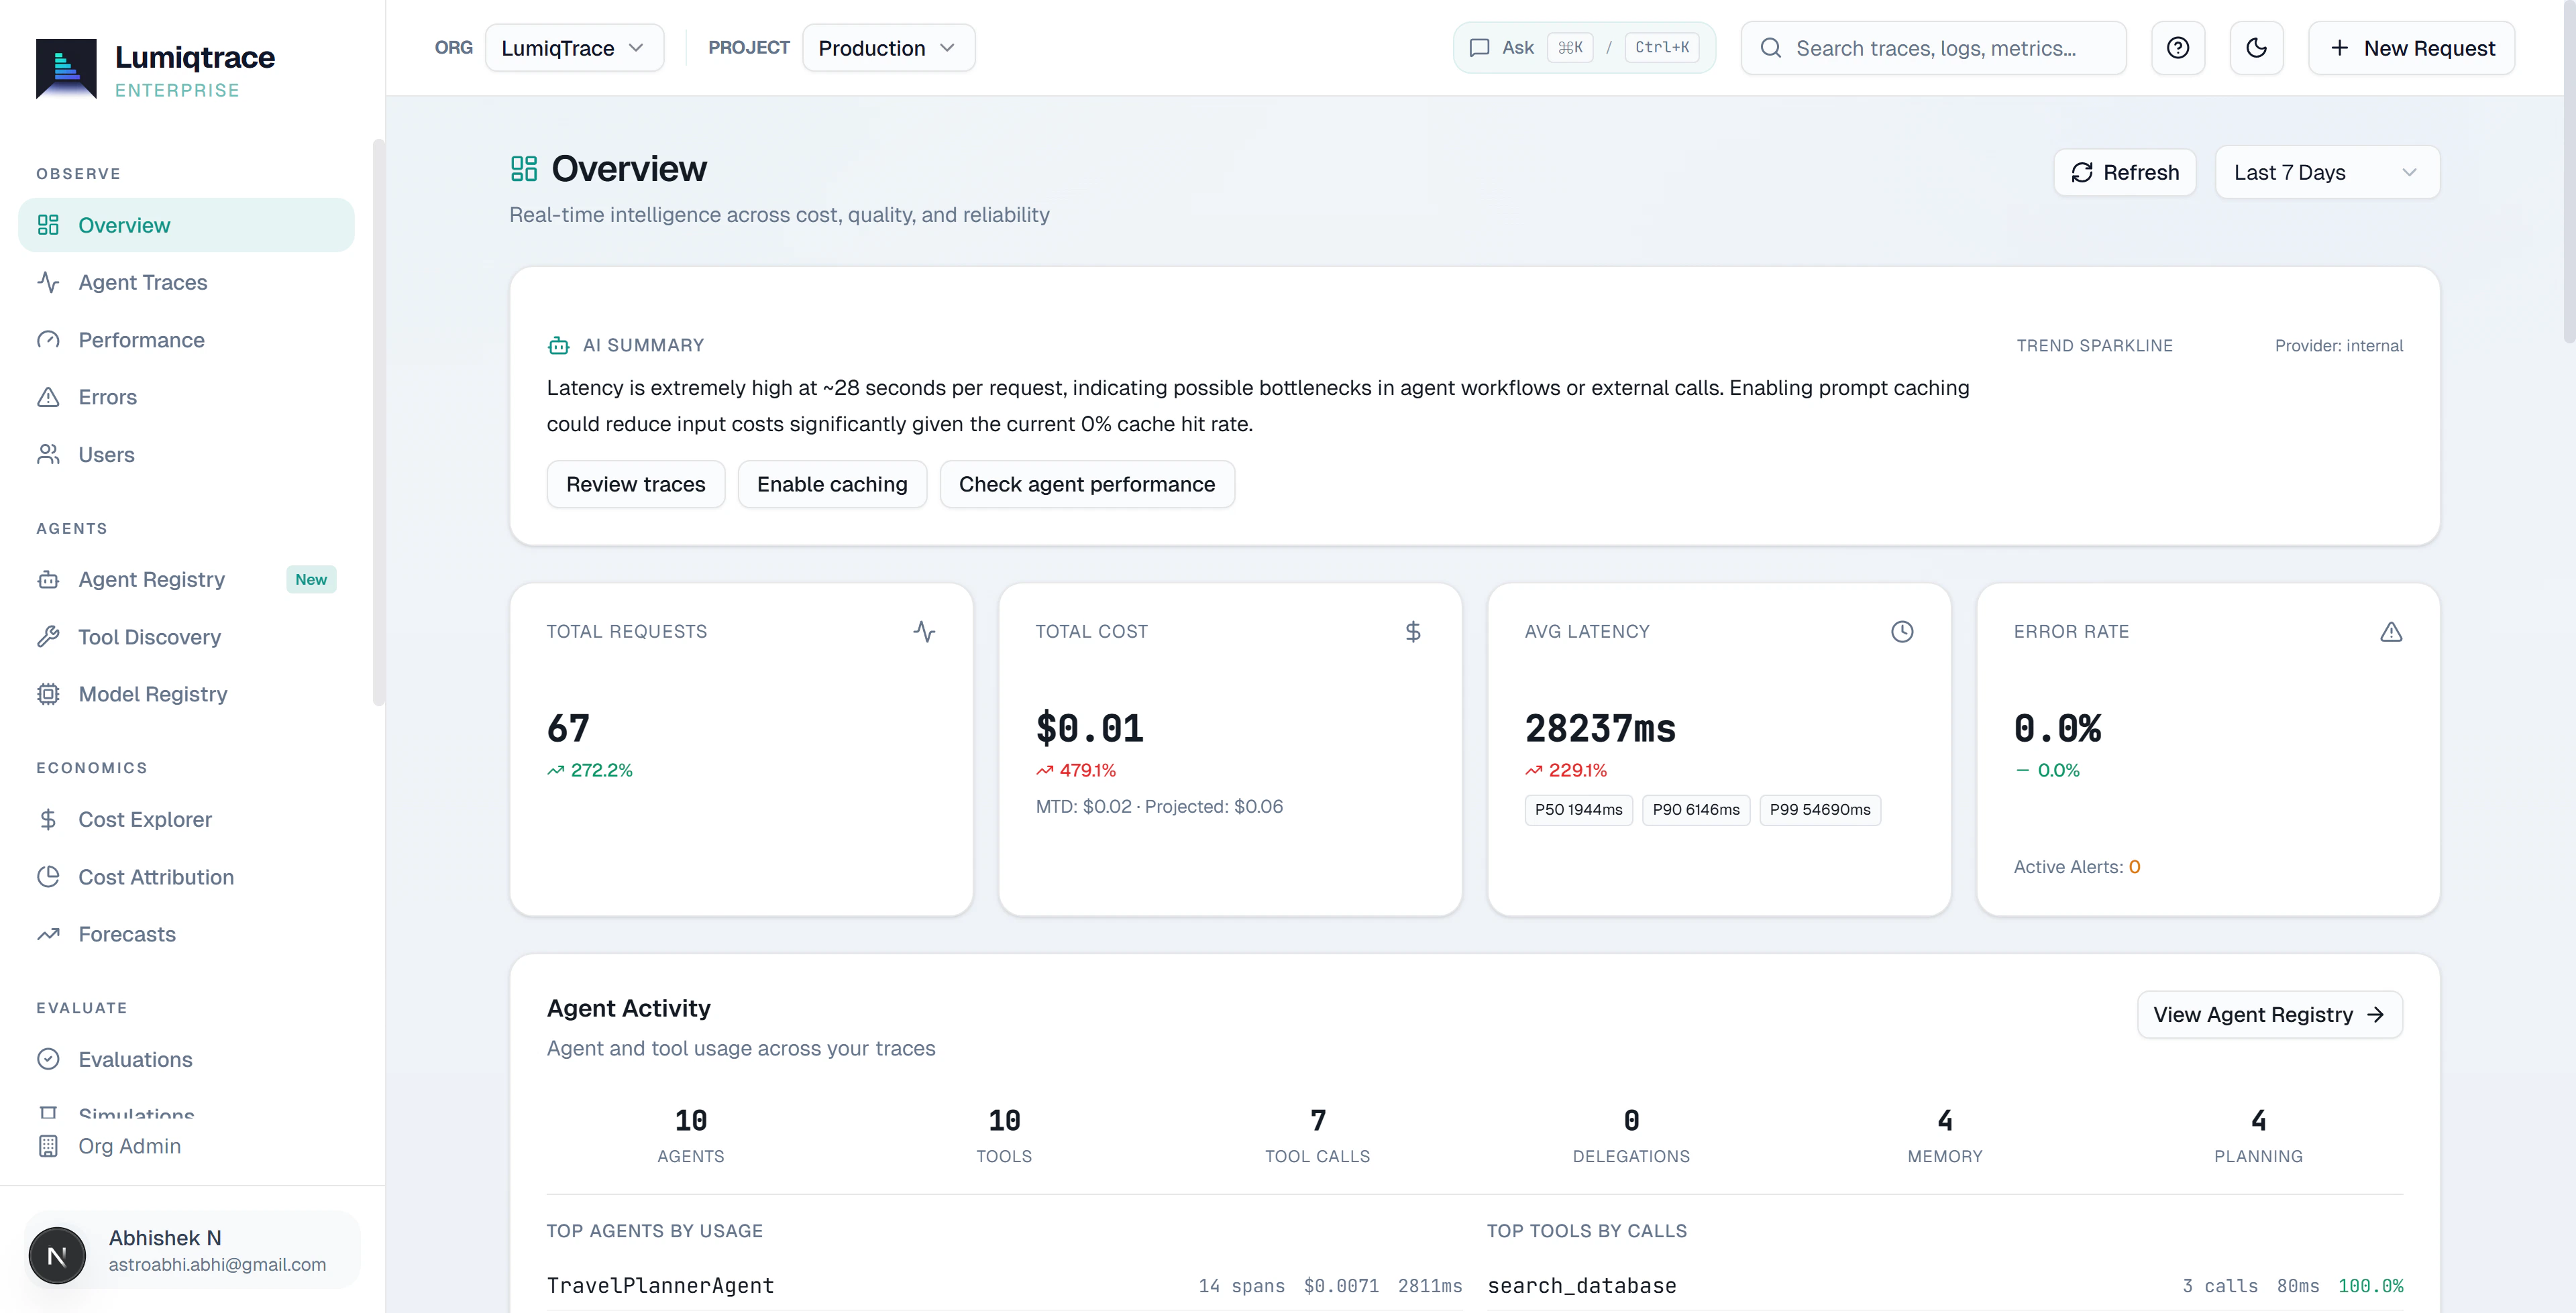
KPI cards
The four cards at the top are your primary indicators. Each shows the current value for the selected time range alongside a trend arrow comparing it to the previous equivalent period.Total requests
The total number of agent operations — LLM calls, tool invocations, and agent turns — recorded in the selected time range.
Total cost
The sum of all agent spend in USD. Cost is calculated from token counts multiplied by each model’s per-token price. Tool calls have no token cost.
Average latency
Mean end-to-end response time in milliseconds across all LLM calls. Use this to detect slowdowns before your users notice them.
Error rate
Percentage of operations that ended in an error, timeout, or rate limit. A rising error rate in an agent system often means a tool is failing or a model is hitting context limits.
Requests and cost timeline
Below the KPI cards, a dual-axis chart plots request volume and cost together over time. The time granularity switches automatically — hourly for ranges under 48 hours, daily for longer ranges. Use this chart to correlate cost spikes with traffic peaks or to identify periods where cost rose faster than request volume — a common sign of agent loops, unexpected retries, or a switch to a more expensive model.Top models by cost
The top models table ranks every model your agents used in the selected period by total spend. For each model you can see call count, total cost, average cost per call, and cache hit rate.Anomaly banner
When anomaly detection identifies a statistical deviation — a cost spike, latency jump, or unusual error rate in your agent traffic — a yellow banner appears at the top of the overview page. The banner shows a plain-English headline and links to the Anomalies tab for the full explanation, business impact assessment, and recommended action.The anomaly banner only appears when an anomaly was detected in the last 15 minutes. Anomaly detection requires the Team plan or higher.
Recent errors
The recent errors list shows the last 10 failed operations — any span with statuserror, timeout, or rate_limited. For each entry you can see the timestamp, model, error code, and latency. Click any row to open the full trace detail and see every step of the agent run that produced the error.
The overview page is available on all plans, including Free.