LumiqTrace is an agent observability platform built for teams shipping AI applications powered by agents. Whether you’re running a single-step RAG pipeline, a multi-agent coordinator with specialists, or a complex agentic workflow with tool use and handoffs — LumiqTrace captures the complete picture of what your agents are doing at runtime: which tools they called, which models they used, how much it cost, how long each step took, and where things went wrong.Documentation Index
Fetch the complete documentation index at: https://docs.lumiqtrace.com/llms.txt
Use this file to discover all available pages before exploring further.
What you can observe
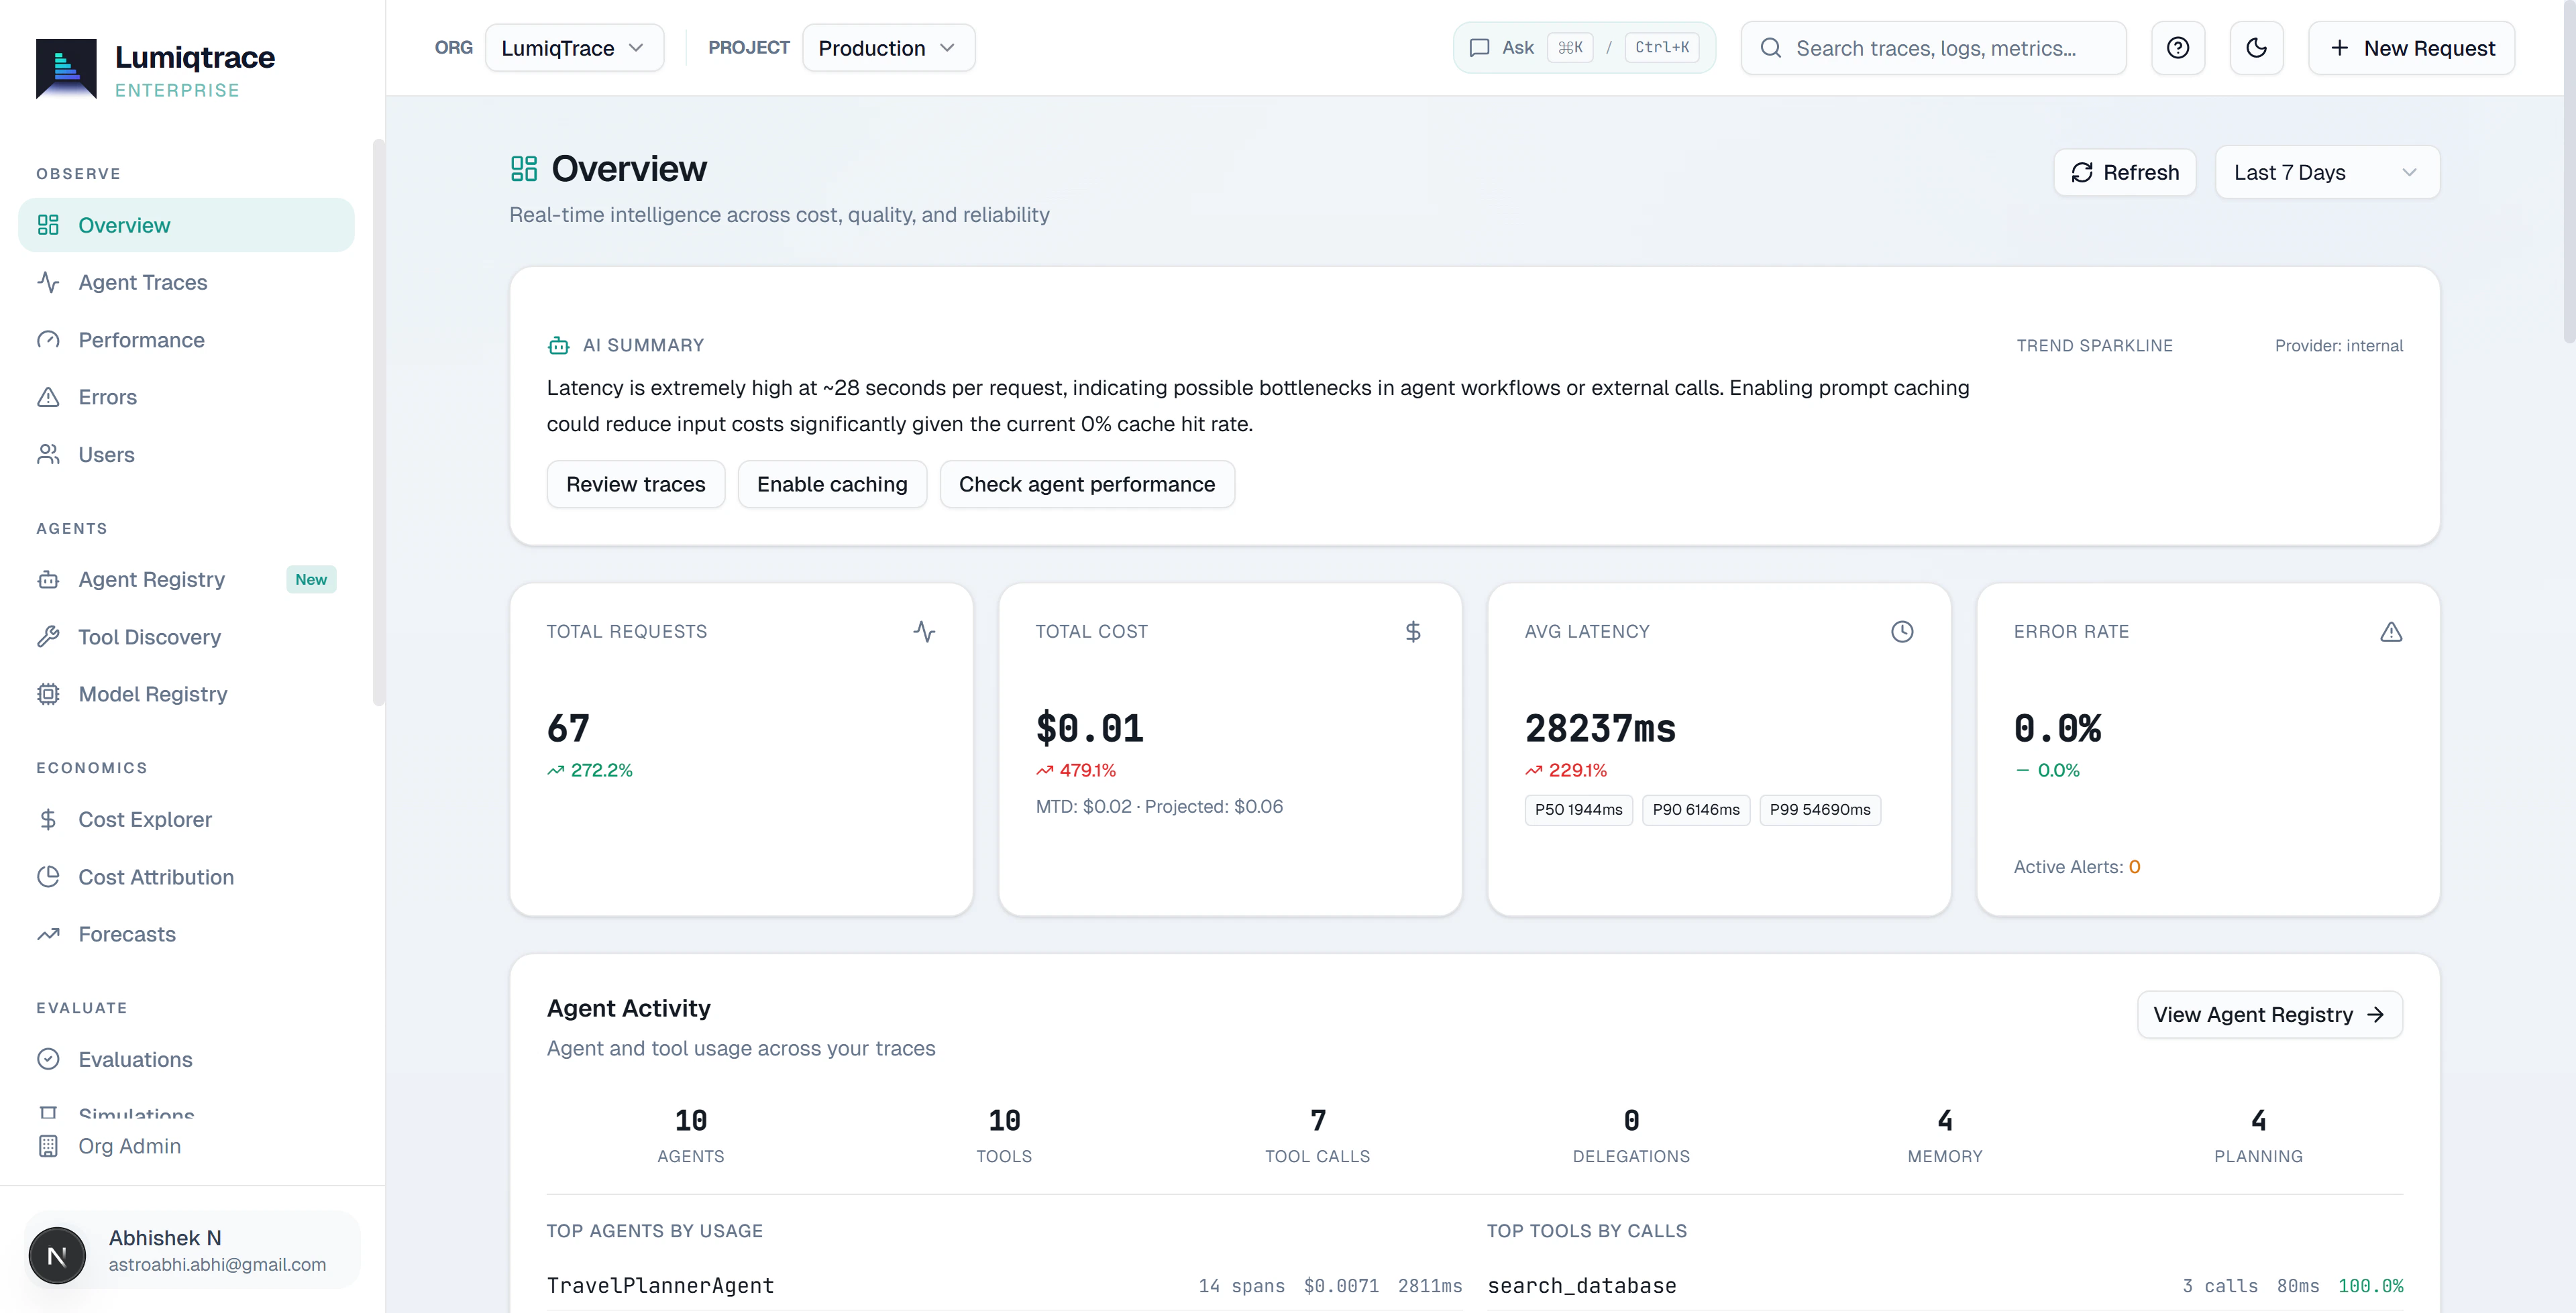
Full agent traces
Follow a user request across every agent turn, tool invocation, sub-agent delegation, and LLM call. The flame graph shows each span’s latency, cost, and status so you can see exactly where time and money are spent.
Multi-agent visibility
See coordinator-to-specialist handoffs, parallel agent runs, and agent delegation chains rendered as a hierarchy. The agent registry maps every agent in your system and the tools they use.
Tool and retriever tracing
Every tool call your agent makes — web search, database lookup, code execution, vector retrieval — is captured as a linked span with arguments, return values, and latency.
Cost attribution
Token costs attributed per agent, per tool, per model, per user, and per session. Know exactly which agent is driving your bill and what its per-run cost is.
Anomaly detection
Background jobs scan your agent metrics every 15 minutes and surface statistically significant deviations — cost spikes, latency regressions, error surges, or agents looping unexpectedly.
AI-powered analysis
Ask questions about your agent data in plain English. Get AI-generated root cause analysis when an agent fails. Receive ranked cost optimization recommendations based on your actual usage patterns.
Who LumiqTrace is for
LumiqTrace is built for engineers and teams building production AI applications with agents. If your application makes LLM calls, uses tools, orchestrates multiple agents, or runs RAG pipelines — you need visibility into what’s happening at runtime. Without observability, debugging agent failures means guessing which step in a multi-step workflow went wrong. LumiqTrace gives you the full picture with two lines of SDK setup. You don’t need to change how you build your agents. Wrap your existing LLM clients and frameworks, and LumiqTrace instruments everything automatically — including LangChain chains, Google ADK agents, and custom multi-agent systems.How it works
Pricing tiers
LumiqTrace charges per organization. Start on the Free tier with no credit card required.- Free
- Pro — $29/mo
- Team — $99/mo
- Scale — $299/mo
For individual developers exploring LumiqTrace or building early prototypes.
| Events per month | 10,000 |
| Data retention | 7 days |
| Projects | 1 |
| Team members | 1 (owner only) |
| Agent tracing | Included |
| Multi-agent traces | Included |
| Cost Optimizer | Not included |
| Anomaly detection | Not included |
| Alerts | Not included |
Free tier events are capped at 10K per month with no overage option. Upgrade to Pro when you need more headroom.
Ready to start?
Instrument your first agent and see it in the dashboard in under five minutes.Quickstart
Install the SDK, wrap your agent or LLM client, and see your first trace appear in the dashboard.